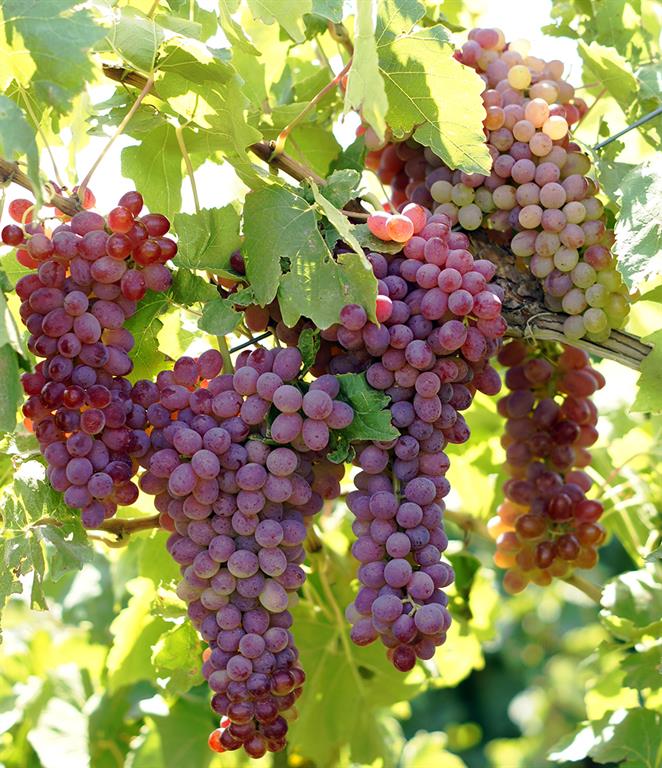
Grapes

Grapes proudction, export, consumption etc
The grape harvest returns 7,000 years in the world and in the middle east 3686 years ago.
Grape usage methods: fresh eating on the tables, raisins, grape juice and concentrate, canned and compote, fumigation and vinegar, grape juice, grape leaves, grape seed oil
Global cultivation: more than 7.1 million hectares (ref: fao, 2016)
World production: more than 77 million tons (11 kg per capita global production) (ref: fao, 2016)
Major producers: spain, china, france, italy, turkey, america, argentina, iran, chile, romania, india (with more than 80 million users)
Major foreign types: major foreign figures: flame seidles, perlat, red gold, robbie seedles; atom royale
iran’s grape fields under cultivation: iran's cultivar: 316,000 hectares (83,000 hectares of dryland), 4.4% of global production and ranked 8th in the world
World production: more than 77 million tons (11 kg per capita global production). (ref: fao 2016)
Grape production (iran, 2017): 800,000 tons, 5% of global production, ranked 9th in the world
Iran’s average yield: 14.4 tons per hectare
Iran’s grape production per capita: 21 kg
Iran's production per capita: 21kg
Major grape cultivars of iran: bidaneh white and red, asgari, sahebi, yaghooti, shahroudi, shahani, pikami, khalili, fakhri and ...
Grape harvesting areas in iran: throughout the country, and major provinces of: fars, qazvin, khorasan razavi, hamedan, west azarbaijan, east azerbaijan, zanjan, north khorasan, kurdistan, central, semnan and ...
The export volume of grape in 2017 from iran was about 11080 tons, which worth about $ 7.2 million ($ 65 / kg)
Exports of fresh grapes in the world: 4.2 million metric tons annually worth $ 8.8 billion ($ 2/kg)
World raisin production: 1.251 million tonnes (ref: fao 2016)
Global raisin exports: 820000 tons worth $ 1.9 billion ($ 2.3/kg)
The largest exporters of raisins in the world: 1. Turkey, 2. America, 3. Iran, and 4. Greece
Iran’s iranian raisin production in 2016: 230000 tons (20% of the total grape production in the world)
Iran’s raisin exports in 2017: 96420 tons, which worth $ 153 million ($ 2.2/kg)
Iran’s raisin export capacity in 2016: more than 200,000 tons
Various types of grain consumption in iran: 1.2 million tons for raisins (28.5 percent), 2.89 million tons of refreshment (54 percent) and waste (15 percent), and 105 thousand tons for vinegar, bergamot, grape juice and grape juice (2.5 percent).
Table 1: the raisin exports and the value of each kilogram
| Year | Weight (thousand tons) | Value (million dollars) | Price in dollar per kg |
| 2007 | 159 | 161 | 1.01 |
| 2008 | 79 | 134 | 1.70 |
| 2009 | 104 | 244 | 2.35 |
| 2010 | 129 | 307 | 2.38 |
| 2011 | 125 | 303 | 2.42 |
| 2012 | 138 | 353 | 2.56 |
| 2013 | 140 | 312.4 | 2.23 |
| 2014 | 113.3 | 296.3 | 2.6 |
| 2015 | 112 | 253.4 | 2.2 |
| 2016 | 135.3 | 281 | 2.1 |
| 2017 | 96.4 | 153 | 1.6 |
Table 2: grape and raisin production from 2008 till 2016
|
Year |
Grape production (tons) |
Raisin production (tons) |
|
2008 |
1927497 |
75000 |
|
2009 |
2187540 |
145000 |
|
2010 |
2371377 |
147000 |
|
2011 |
2426506 |
150000 |
|
2012 |
2441000 |
155000 |
|
2013 |
2755658 |
162000 |
|
2014 |
2900000 |
160000 |
|
2015 |
3167437 |
170000 |
|
2016 |
3420000 |
230000 |
|
2017 |
3800000 |
200000 |
|
2018 |
3.100.000 (estimated) |
150.000 (estimated) |
Table 3: development of vineyards in different provinces from 2017 till 2021 (in hectare)
Table 4: funds required for the development of vineyards in various provinces from 2017 till 2021 (in million rial)


